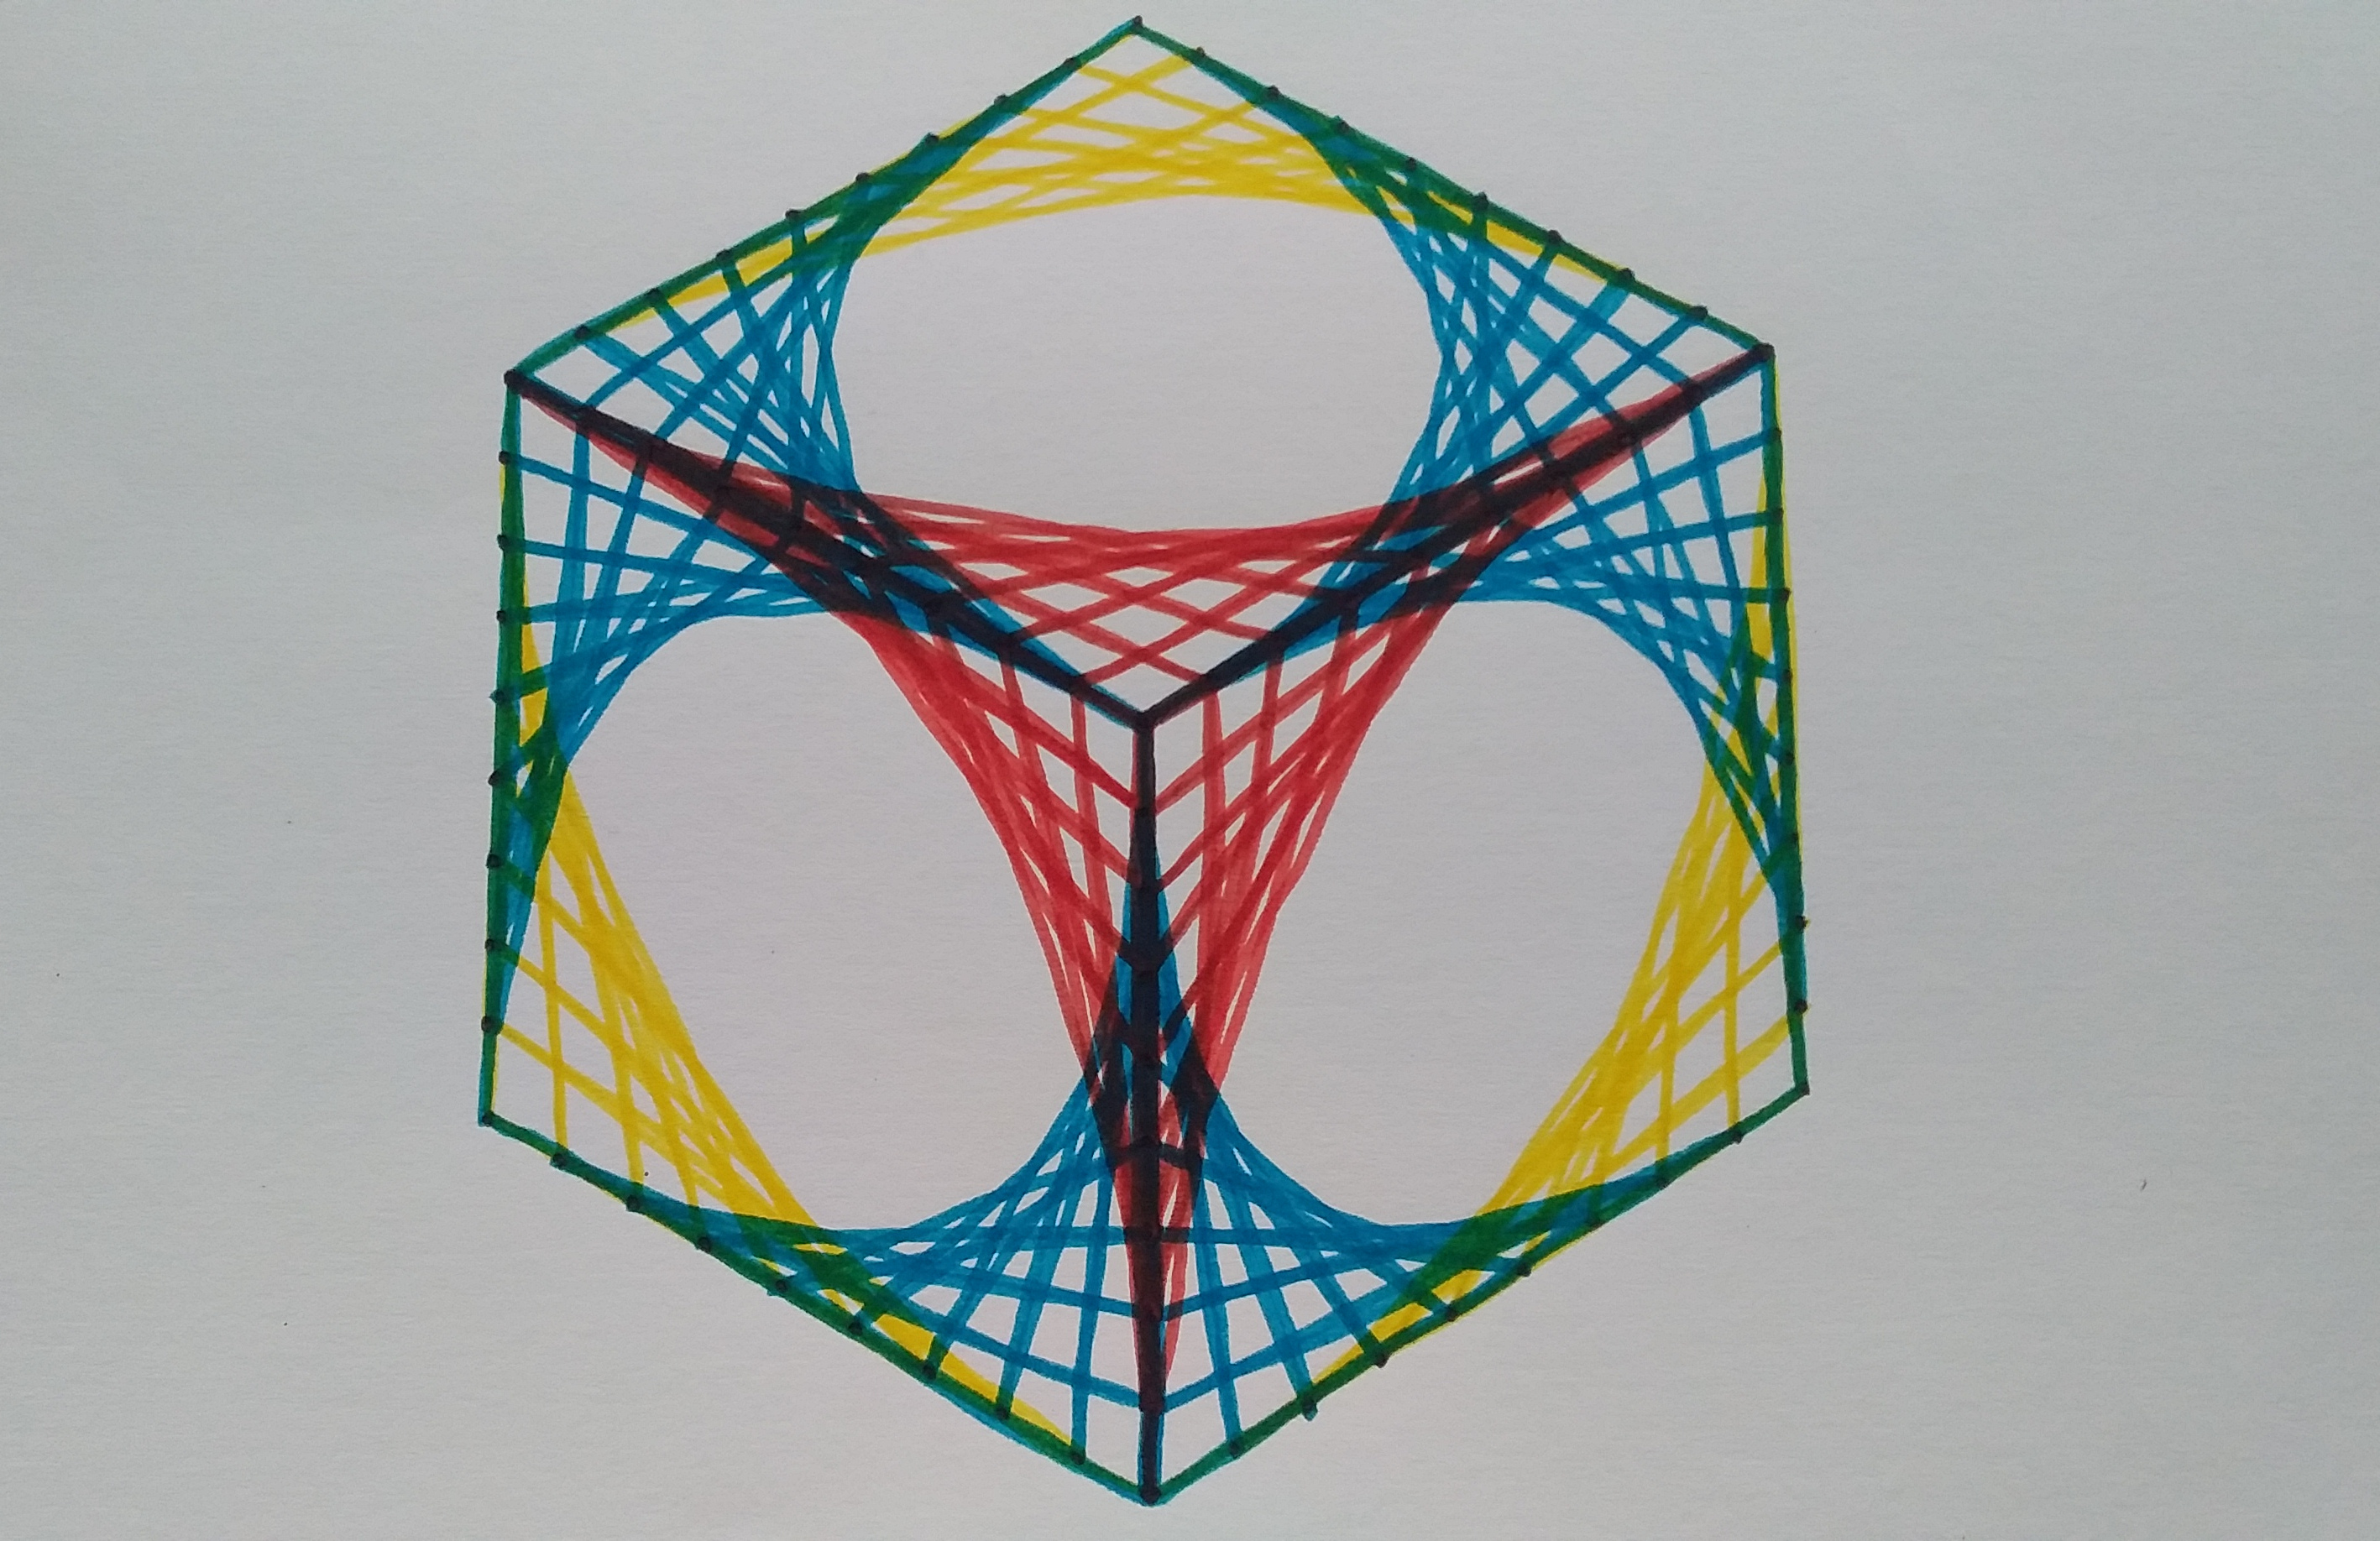
My sister had to do some artwork for school, and she decided to make some curved shapes out of lines. It looks pretty cool (although it would have been even better with pencil I think, but she wouldn’t listen, and I’m too lazy to do it myself right now), and making curves out of just lines, well, I find that pretty fancy. But I wondered what the curves actually were… Circles? Parabolas? Ellipses? Something different?
Note: the artwork wasn’t for her art subject, but for mathematics. They had to draw something that looked cool with patterns. How sweet!
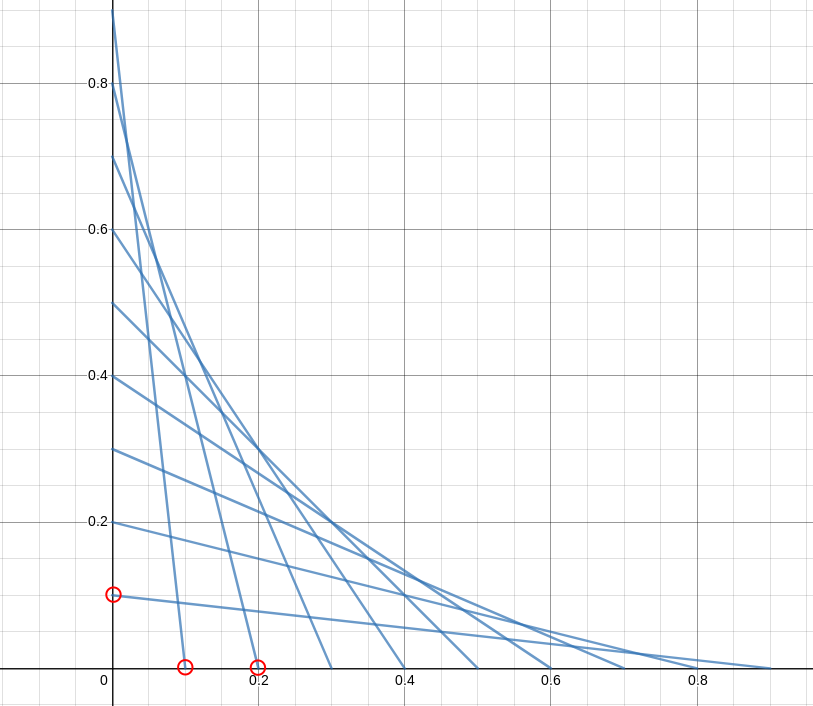
I drew something of the kind on desmos, according to the following rule:
We take 2 perpendicular lines (the x-axis and the y-axis), and we define an distance $d$. The $i$th line, goes through two points: $(0, 1 - d \cdot i)$ and $(d \cdot i, 0)$.
We want to keep every line between $0$ and $1$, therefore we let $d = \frac{1}{n_{lines}}$. Here’s what we get with 10 different lines:
What happens as we increase the number of lines? Well, play around:
The curve just “defines itself”.
So, we want to find the equation of the curve this pattern approaches as the number of lines increases towards infinity.
Using the gradient
I tried to express the gradient of the curve as a function of x (because then all you have to do is integrate to find the actual curve). The reason I thought of that is because I realised that each line was a tangent to the curve.
The gradient of the curve at some $x_0$ would be the same as the gradient of the tangent at that point, ie. one of the lines. But which one?
If you think about it for a second, it becomes obvious that it has to be the highest line at that very $x_0$.
Alright, firstly, we need the equation of every line. Since they all go through two known points $(0, 1 - di)$ and $(di, 0)$, where $i$ is the line index (the first line, the second line, etc) and $d$ the distance between the intercepts:
$$ \begin{aligned} \frac{y - y_1}{x - x_1} &= \frac{y_1 - y_2}{x_1 - x_2} \b \frac{y - (1 - di)}{x - 0} &= \frac{(1 - di) - 0}{0 - di} \b y &= \frac{di - 1}{di}x + 1 - di \b \end{aligned} $$
Just to avoid some confusion later on, we will express our lines in terms of the total number of lines instead of the distance between the intercepts (remember that $d = \frac{1}{n_{lines}}$). Just to preserve my personal health, I’ll also rename $n_{lines}$ to $n$.
$$ \begin{aligned} y &= \frac{\frac{i}{n} - 1}{\frac{i}{n}}x + 1 - \frac{i}{n} \b y &= \frac{i - n}{i}x + 1 - \frac{i}{n} \b \end{aligned} $$
Now, we want to solve for $i$, where $y$ will be a maximum at some given $x$.
Finding a maximum sounds like calculus to me. Find the rate of change, and when that change is 0, that’s either a maximum or a minimum. The trick here is that we want to find the maximum $y$ as $i$ changes, not $x$. Therefore, we treat everything else ($x$ and $n$) as constants - because they are, and differentiate in terms of $i$.
$$ \begin{aligned} y &= \frac{i - n}{i}x + 1 - \frac{i}{n} \b &= (1-\frac{n}{i})x - \frac{i}{n} \b \frac{dy}{di} &= \frac{nx}{i^2} - \frac{1}{n} \end{aligned} $$
Now, we just solve for $\frac{dy}{dx} = 0$
$$ \begin{aligned} 0 &= \frac{nx}{i^2} - \frac{1}{n} \b n &= \frac{i^2}{nx} \b i &= n\sqrt{x} \end{aligned} $$
We only care about the positive version because we only have positive line indexes. And, I won’t bother proving that it’s a maximum, and not minimum, because it’s obvious from the diagram.
So, what does this result mean again? The index of the line which is tangent to the curve at $x$ is given by $i = n \sqrt{x}$.
Now, we can easily express the gradient in terms of $x$ since we know the equation of the $i$th line:
$$ \begin{alignedat}{3} y &= \frac{i - n}{i}x + 1 - \frac{i}{n} \qquad && \text{equation of the ith line} \b \therefore m &= \frac{i - n}{i} = 1 - \frac{n}{i} && \text{substitute } i = n \sqrt{x} \b \frac{dy}{dx} &= 1 - \frac{n}{n \sqrt{x}} \b &= 1 - \frac{1}{\sqrt{x}} \end{alignedat} $$
Integrate in terms of $x$:
$$ \begin{aligned} y &= \int (1 - x^{-\frac{1}{2}})\ dx \b &= x - 2 \sqrt{x} + c \end{aligned} $$
We know that the curve goes through the point $(1, 0)$, so $c = 1$, and our equation is:
$$ y = x - 2 \sqrt{x} + 1 $$
And it works! It seems to match pretty nicely with lines on desmos, you can try it yourself just above!
Now, I don’t think that’s a proof, because I did make a pretty big assumption: the highest line at any is x is tangent to the curve at that x. Now that “makes sense” if you think about it, but I’m not sure how I could prove it rigorously… Some more thinking I guess :-)
Would you have done it another way? Shoot me an email, I want to know!
So, what is it actually?
Well, if you get rid of the square root (move it to one side, and square both sides), you get this:
$$ \begin{aligned} y^2+x^2-2xy-2x-2y+1=0 \end{aligned} $$
And it kind of looks like a tilted parabola, which I’m willing to accept because parabolas are symmetrical, and that pattern should be symmetrical too. In this case, the parabola seems to be symmetrical about the line $y=x$ (ie. it’s tilted 45 degrees).
I doubt this is the best way to show that it actually is a parabola, but I’ve “rotated” the equation 45 degrees anti-clockwise. The way I did that was by substituting in $x = r \cos(\theta + \frac{\pi}{4})$ and $y = r \sin(\theta + \frac{\pi}{4})$, expanded and substituted $r \cos(\theta) = x$ and $r \sin(\theta) = y$.
Note that you don’t actually need the $r $ scaling, but it just makes more sense in my head (every point $(x, y)$ is expressed as $(r \cos \alpha, r \sin \alpha)$, and then spin everything by increasing/decreasing $\alpha$, and switch back to $(x, y)$.
$$ 2\sqrt{2}y=2x^2+1 $$
And that’s indeed parabola…
Note that you can do all that expanding work with a few lines of code (note that we do need to tell sympy to expand the trig functions and the expand everything to cancel out stuff, so that it can easily substitute back):
import sympy

x, y, r, theta = sympy.symbols("x, y, r, theta")

at45 = x ** 2 + y ** 2 - 2 * x * y - 2 * y - 2 * x + 1
vertical = at45.subs({
    x: r * sympy.cos(theta - sympy.pi / 4),
    y: r * sympy.sin(theta - sympy.pi / 4)
})
cartesian = sympy.expand_trig(vertical)
print(sympy.expand(cartesian).subs({
    r * sympy.cos(theta): x,
    r * sympy.sin(theta): y,
}))
What’s next?
Well, I want to generalize to different linear spacing between the two axies (ie $d$ is different for the x axis and the y axis), and for axies that aren’t perpendicular. Hopefully I’ll develop some intuition as to why this is a parabola… I feel it has to do with the reflection property (you throw anything at a parabola, parallel to its axis of symmetry, and it’ll go through it’s focus).